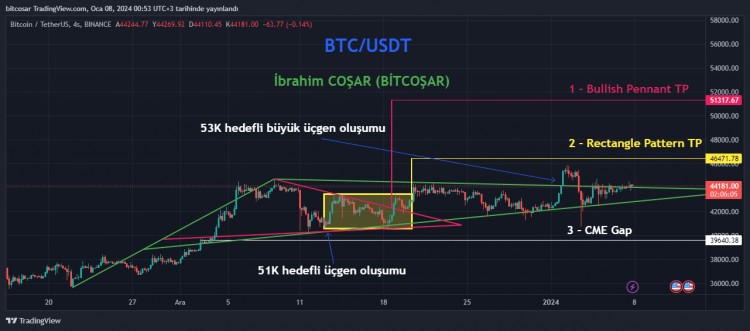
When we looked at the technical outlook of Bitcoin, I gave 3 different scenarios. In fact, I previously showed that the triangle formation with a target of 51K was updated and a larger triangle formation with a target of 53K was formed.Now this 53K target big triangle formation target was canceled because there was a fake breakout.But we are back to the previous 51K targeted triangle formation, so it is still active and it must fall below the 40K level for it to be a fake breakout or cancellation.However, Bitcoin followed the lower band of this 53K large triangle formation very well. If you examine the chart, you will see that it did not close below this level and the bottoms continue to rise.Secondly, the rectangular formation I gave is still actively on the table and the price target remains at $46,500. We tested the $46,000 level a week ago, but we still couldn't hit the formation target.If we make a daily close above the $44,400 level, we can first see the $46,500 target. If we close above $46,500 for two consecutive days, this time we can move to 51K, which is the triangle formation price target. Unfortunately, the CME scenario (38K-40K region) is still on the table. I do not want to write this again. Those who want to read it should read my previous articles, I gave a lot of detailed information.Daily close below $42500 is dangerous!*** Follow us to avoid missing content and last-minute developments that will benefit you.